
 Carlos Solis
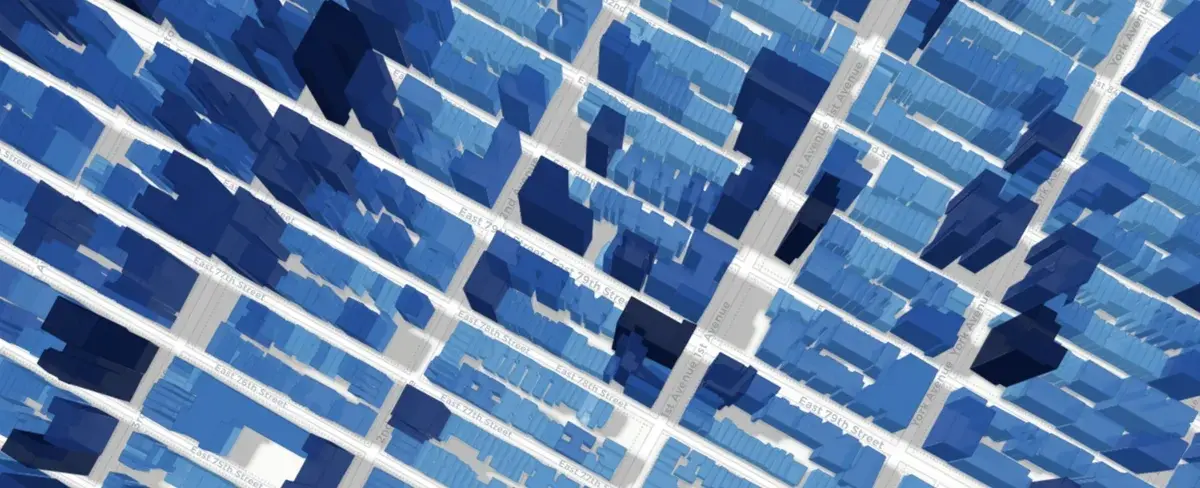 Google Maps has a new competitor. Using a machine-learning model, engineers at the Technical University of Munich have built an interactive map that displays 3D models of 2.75 billion buildings worldwide. That covers nearly every building on the planet.
Oh, look: that’s your house!
That line now feels literal. Anyone can find their home on this map, no matter where it’s located.
The university team applied a machine learning model to high-resolution satellite images to automatically detect building outlines and estimate their heights. The results, generated with the help of artificial intelligence, were then combined with data from high-precision maps.
Ultimately, the researchers succeeded in creating 3D models for nearly every building on Earth, as reported by IFLScience.
A New Era in Cartography
The previous largest global dataset for highly detailed maps contained about 1.7 billion structures—over a billion fewer than what GlobalBuildingAtlas includes. Project authors called it “the most comprehensive collection of data of its kind.”
Among all the buildings mapped, your home, favorite restaurant, or even the hospital where you were born might be included. Each building is represented with a resolution of 3 by 3 meters, capturing its shape and size with high accuracy.
The map even includes detailed representations of buildings in regions often missing from global maps, such as Africa, South America, and rural areas worldwide.
However, the developers of GlobalBuildingAtlas warn users: “This product was created using machine learning. It may contain errors.”
This super map is not just a toy to admire on a phone during long bus rides. Researchers hope their work will find applications in a range of fields, from urban planning and disaster prevention to environmental research and healthcare development.

“Three-dimensional information about buildings provides a much more accurate picture of urbanization and poverty than traditional two-dimensional maps,” said Professor Xiaoxian Zhu, the project leader. “With 3D models, we can see not only the footprint of buildings but also their volume, which helps us gain much more precise insights into living conditions. We are introducing a new global metric: building volume per capita. This is an indicator of housing construction and infrastructure that reveals social and economic inequality. It will promote sustainable urban development and help cities become more inclusive and resilient,” she added.
The map is already very popular. Because of very high traffic, some data may not load completely.
But if you’re determined to find your own house, give it a try here.
The results of the new study were published in the journal Earth System Science Data.